unknown Brand Identity 2020
About
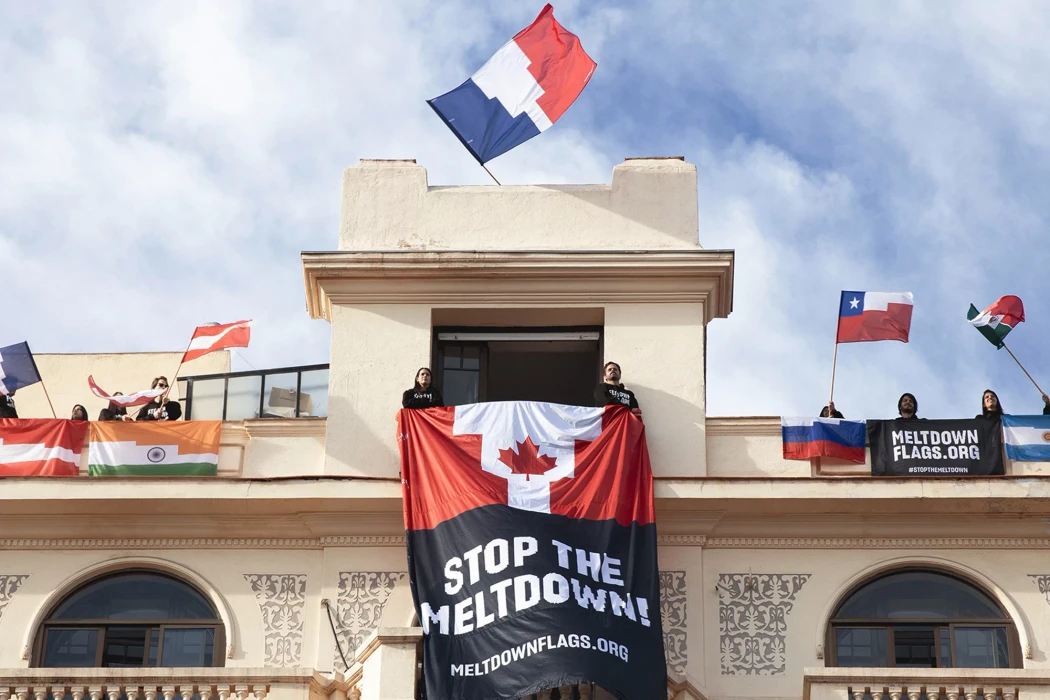
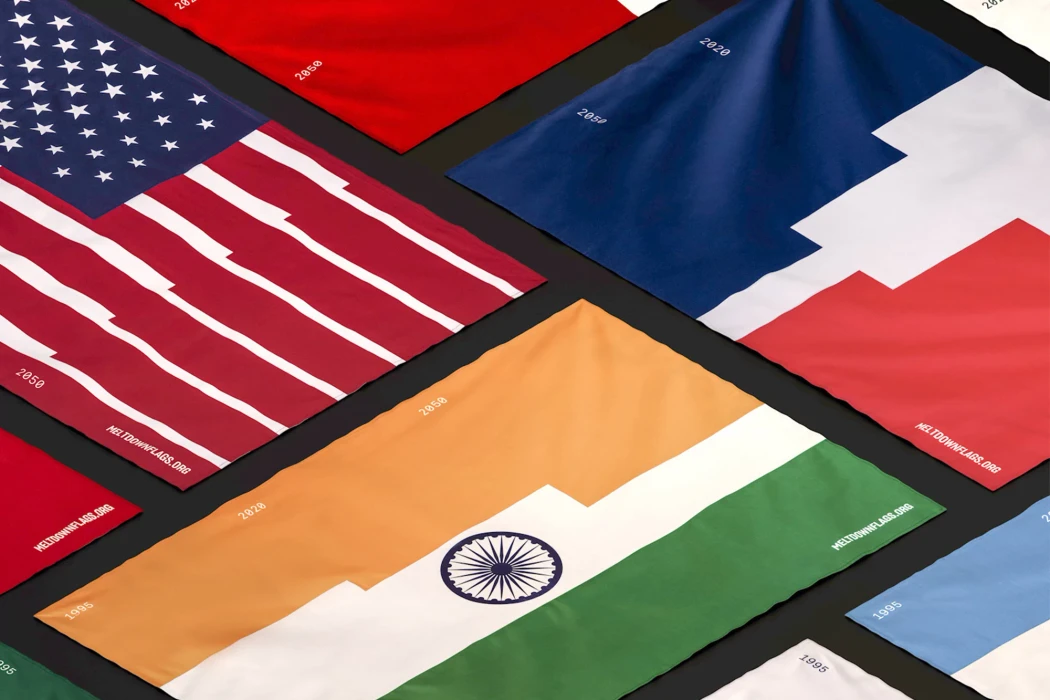
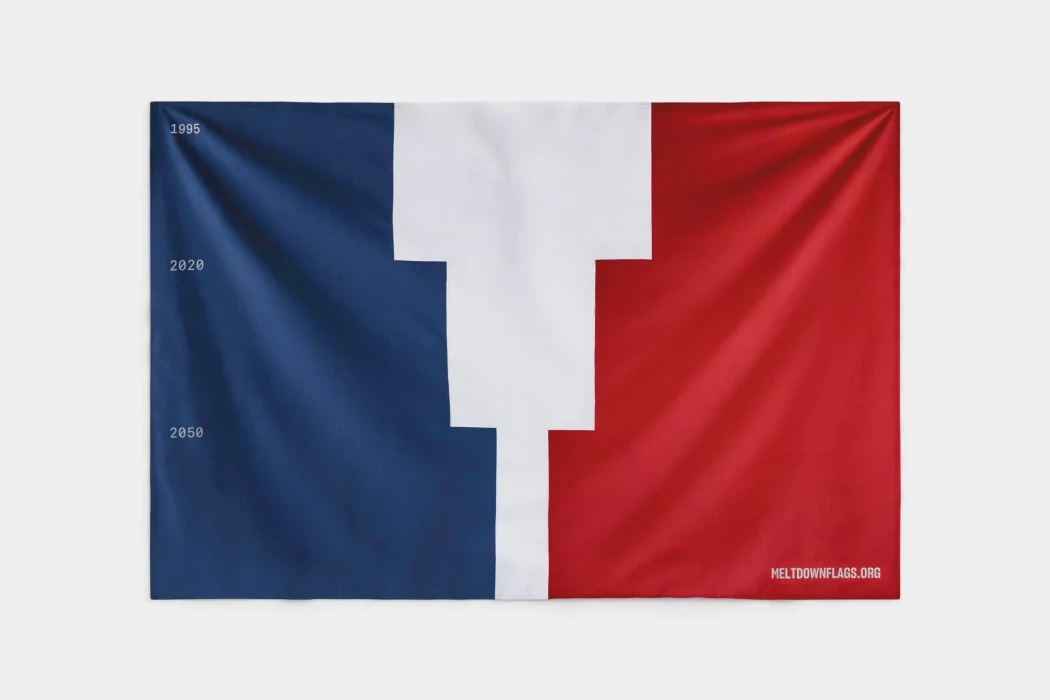
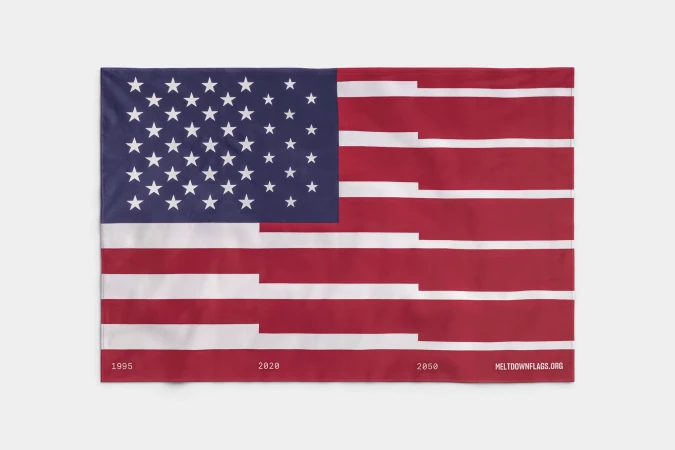
This video showcases an interactive digital interface for a data visualization website titled MeltDownFlags.org, created with graphic design by Moby Digg. The browser window displays the American flag alongside dynamic statistical data including year progression, area of UNESCO glaciers, and median annual temperature. As the timeline advances from 2007 through future projections to 2050, the graphic representation of the flag progressively dissolves and shrinks. Additional data sections display metrics on glacier retreat, population, emissions, and land mass against a textured mountain background. The clean, modern web interface utilizes minimalist typography and structured data layouts to communicate environmental data.
Brand
Project
Keywords
Credits
Styles
Techniques
Industries
Background
Mountain
Context
Website / Web