BrandT1 Energy
ProjectBrand Identity
Mouthwash Studio, Design,
Associated creatives


Tags
Description
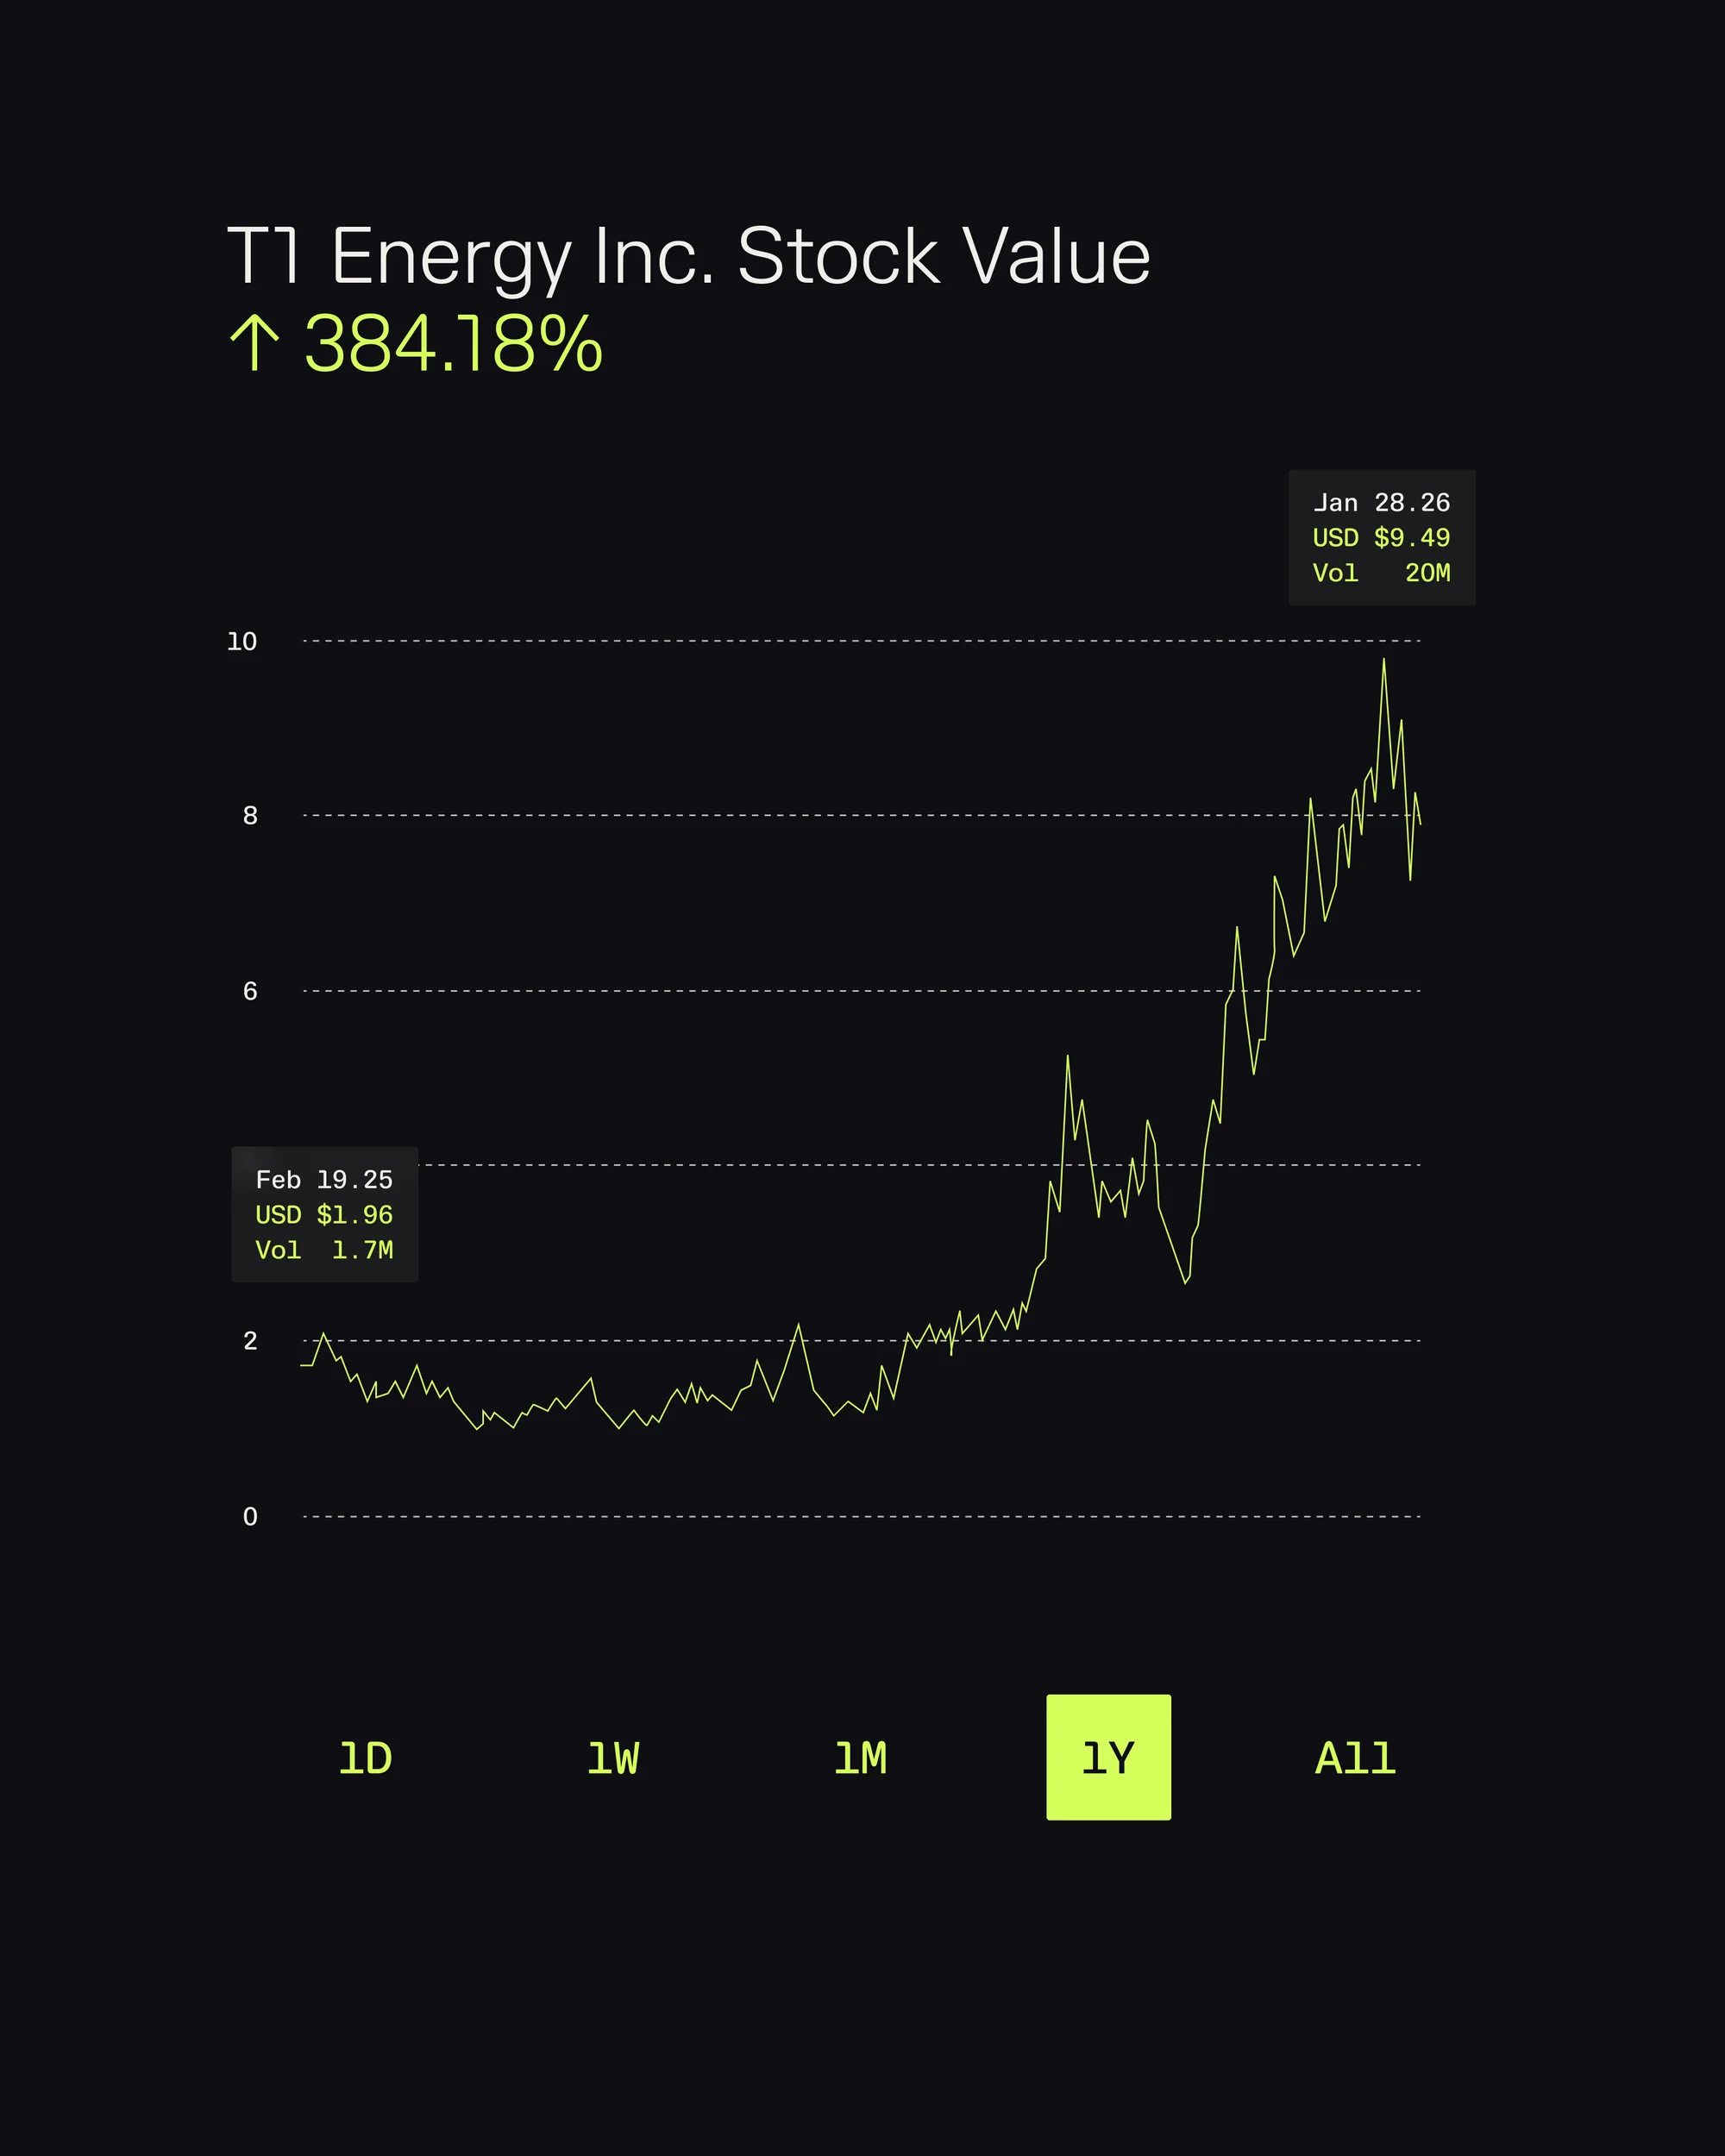
A line graph shows the stock value of T1 Energy Inc. over time. The chart shows the dates Feb 19.25 and Jan 28.26, including USD values. The overall trend illustrates a significant increase of 384.18%. The graph also labels the periods 1D, 1W, 1M, 1Y, and All. The background is dark, with light-colored text and gridlines enhancing visibility of the data.